Argo浮标路径绘制

关于Argo浮标轨迹绘制代码

前几天老板让我绘制中国投放的Argo浮标在西北太平洋地区的轨迹,写下来方便以后看,第一眼看上去数据存放很嘈杂,但是实际处理起来没那么麻烦。

数据文件说明

从网站上下载下来的文件名是argo_bio-profile_index.txt,在这个文件夹中,前几行带有#前缀的是注释。

具体就不解释了,都有文件说明,看得懂英语的都能看懂吧。#后面第一行file,data,latitude...是后面数据的标题,代表每个数据的含义是什么,这里面写明了文件的路径(file),日期,经纬度等。

数据文件读取

在读取该数据时,使用的主要工具是python的Pandas工具。以前没有怎么用过Pandas处理数据,感觉这个工具来处理csv文件是真的好使,虽然这个文件是txt格式,但是同样可以被当作csv来处理,因为Pandas文件的默认分隔符是逗号,而在这个txt里面分隔符正好是逗号(坏笑)

在读取这个文件的时候,要先删除注释行,变成这样:

好,然后使用Pandas读取,先导入需要使用的包

1
2
3
4
5
6
7
8
9
10
11
12
#!/usr/bin/python3
from matplotlib import colors
import pandas as pd
import numpy as np
import os
import matplotlib.pyplot as plt
import cartopy.crs as ccrs
import cartopy.feature as cfeature
from cartopy.mpl.ticker import LongitudeFormatter, LatitudeFormatter
import matplotlib.ticker as ticker
from matplotlib.pyplot import MultipleLocator
color_list = list(colors.XKCD_COLORS.items()) # 这个列表是为了循环颜色。说明白点就是,浮标的数量太多,我懒得一个一个定义颜色,所以直接获取包里面的颜色,使用十六进制来设置颜色,后面还会提到。

在画轨迹的时候还需要使用到Cartopy工具来绘制地图。接下来

1
2
3
4
5
6
7
8
9
10
11
12
13
14
15
16
17
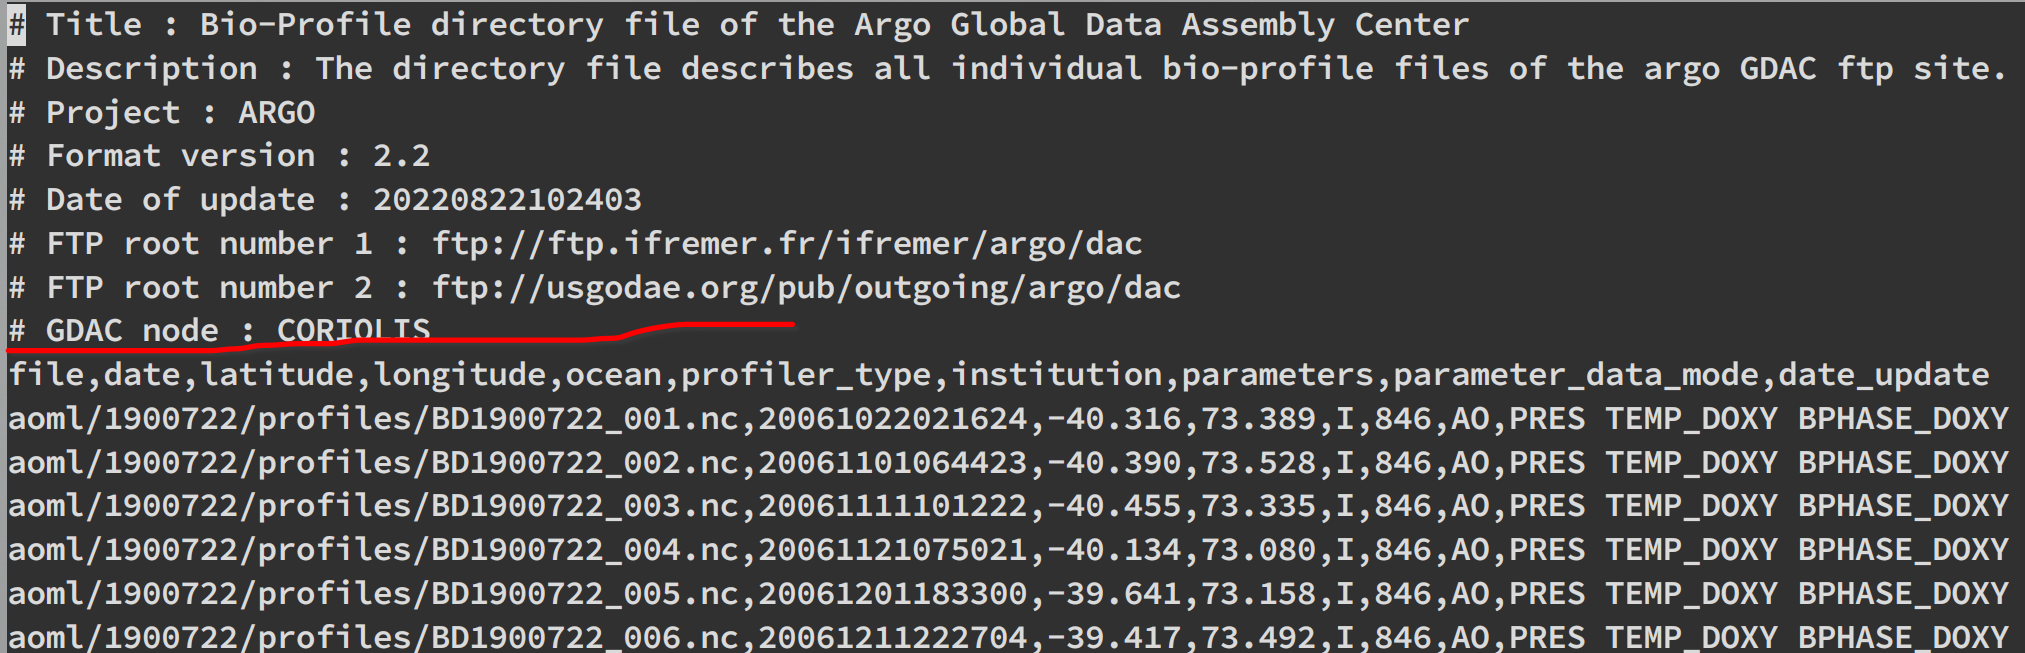
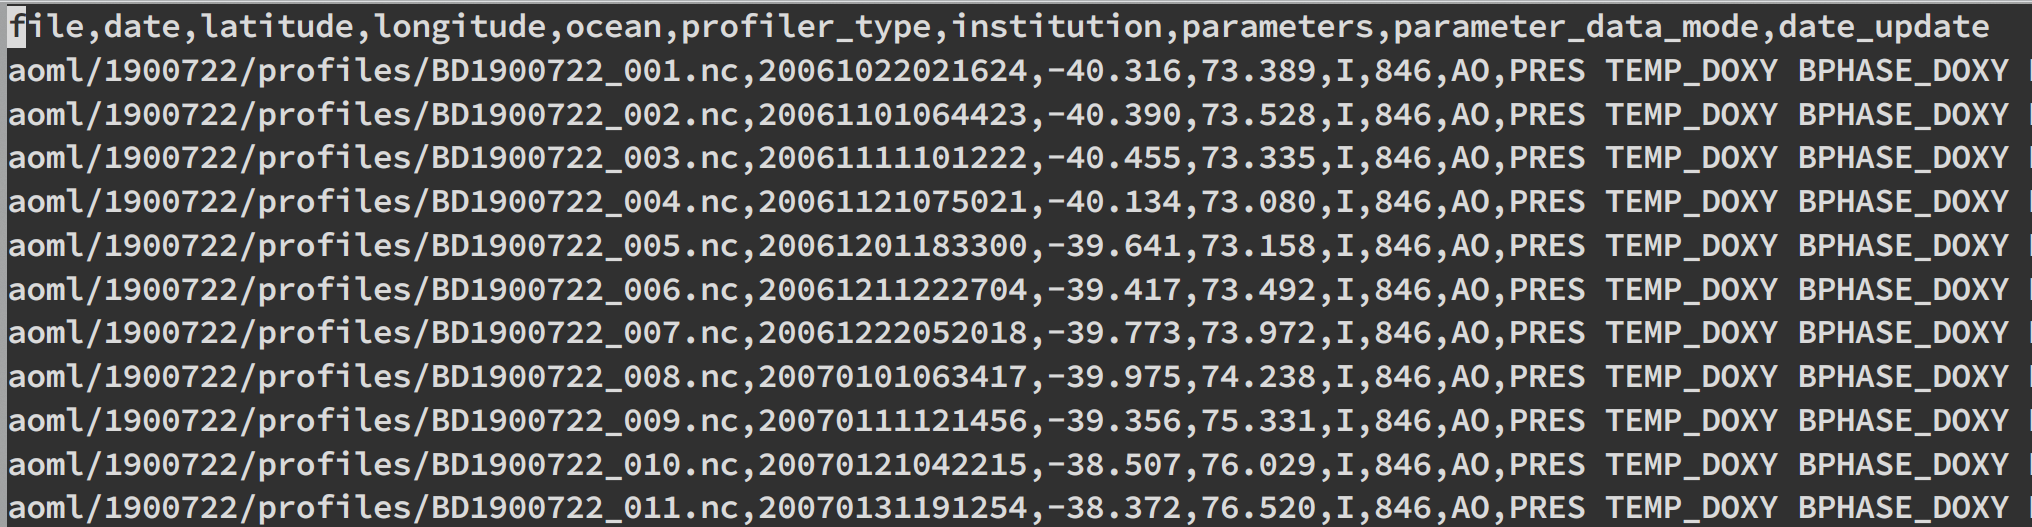
# out = pd.read_csv('argo_bio-profile_index.txt')  # 读取原始的txt文件
# for i_file in range(len(out['file'])):
# temp = out['file'][i_file].split('/') # ['aoml', '1900722', 'profiles', 'BD1900722_001.nc']
# if temp[0] != 'csio': # 这一步是为了筛选csio的产品,如上面文件名所示,产品有aoml等,这里我们只需要csio的产品,(老板要求的
# out = out.drop(labels=i_file) # 如果产品不是csio就把这一行删除
# out.to_csv('result.csv') # 存下来,以后直接读取这个处理好的文件,减少运算时间

# out = pd.read_csv('result.csv')
# for i_file in range(len(out['file'])):
# out['file'][i_file] = out['file'][i_file].split('/')[1] # 提取第一列的浮标号作为第一行的信息
# out.to_csv('final.csv') # 同样存下来

out = pd.read_csv('final.csv')
data_pacific = out.loc[out['ocean']=='P'] # 海洋的标签下包括I印度洋,A大西洋,P太平洋 这里我们筛选出来太平洋的数据,注意引用的方法,非常好用!!!避免循环浪费时间
id_data = np.array(data_pacific['file']) # 筛选完以后,这时的数据就是csio的所有太平洋的数据,但是每个浮标包括许多剖面也就是很多行,这里提取文件名
id_data = np.unique(id_data) # 删除重复的文件名,得到csio在太平洋的所有浮标名
print(len(id_data)) # 总共有40个浮标

处理完数据开始画图:友情提示,Cartopy用法不熟练的朋友可以去看炸鸡人的博客,关于画图的部分不多赘述。

1
2
3
4
5
6
7
8
9
10
11
12
13
14
15
16
17
18
19
20
21
22
23
24
25
26
27
28
29
30
# plot
fig = plt.figure(figsize=(10, 5))
proj = ccrs.PlateCarree(central_longitude=180)
ax = fig.add_subplot(111, projection=proj)
ax.coastlines()
extent = [90, 270, 0, 90]
ax.coastlines(resolution='110m')
ax.add_feature(cfeature.OCEAN.with_scale('110m'), facecolor='white')
ax.add_feature(cfeature.LAND.with_scale('110m'), facecolor='lightgrey')
ax.add_feature(cfeature.LAKES.with_scale('110m'), edgecolor='black')
ax.add_feature(cfeature.RIVERS.with_scale('110m'))
ax.add_feature(cfeature.BORDERS.with_scale('110m'))
ax.set_xticks(np.arange(90, 300, 30), crs=ccrs.PlateCarree())
ax.set_yticks(np.arange(-60, 100, 30), crs=ccrs.PlateCarree())
ax.xaxis.set_major_formatter(LongitudeFormatter())
ax.yaxis.set_major_formatter(LatitudeFormatter())
ax.set_title('Buoy path')
color_num = 0
for i_num in range(len(id_data)): # loop all buoys
temp_buoy = data_pacific.loc[data_pacific['file']==id_data[i_num]] # 提取出来数据中含这个浮标的所有行,也就是提取这个数据中这个浮标的所有剖面
temp_buoy = temp_buoy.reset_index() # 这一步至关重要,因为你提取出来索引还是原来的索引,不是从零开始重新排序的,所以要重新设置一下,让得到的Dataframe的索引从零开始排序
color_num = color_num + 1 # 这个用法是为了循环不同的颜色,再包一层循环的话显得很冗余
for i_buoy in range(temp_buoy.shape[0]): # 循环该浮标的所有剖面
if i_buoy != (temp_buoy.shape[0] - 1): # 只画两点之间的折线,所以只要循环到倒数第二个点
if temp_buoy['longitude'].loc[i_buoy] < 0: # 这一步也至关重要:) 因为文件中经度的存储方式是-180-180,直接画会出错,所以要改成从0-360的存储方式
temp_buoy['longitude'].loc[i_buoy] = temp_buoy['longitude'].loc[i_buoy] + 360
if temp_buoy['longitude'].loc[i_buoy + 1] < 0:
temp_buoy['longitude'].loc[i_buoy + 1] = temp_buoy['longitude'].loc[i_buoy + 1] + 360
ax.plot([temp_buoy['longitude'].loc[i_buoy], temp_buoy['longitude'].loc[i_buoy + 1]], [temp_buoy['latitude'].loc[i_buoy], temp_buoy['latitude'].loc[i_buoy + 1]], color=color_list[color_num][1], transform=ccrs.PlateCarree()) # 这里的定义颜色就是把十六进制的数作为关键字输入
plt.show()

到这里就结束了,记录下来,方便以后查看吧,不定时更新。

Author: bluefatshao

Permalink: http://example.com/2022/11/14/argo-path/

文章默认使用 CC BY-NC-SA 4.0 协议进行许可,使用时请注意遵守协议。

Comments